Monitoring
Monitoring Dashboard is able to provide near real-time monitoring information about your pipelines across multiple instances of the Live Transcoder / Bridge Live.
How to enable Monitoring
Enable monitoring for Docker deployments
In the docker-compose.yml under the environment section, change this line
# - TRC_monitoring_enabled=1to
- TRC_monitoring_enabled=1YAML files require correct indentation, so be sure to check that after you've changed the line, it is indented by two spaces from its parent section
environment. You can look at other lines under theenvironmentsection to see if the indent of the changed line is correct.
Then you can start the Live Transcoder Docker container with:
docker-compose up -dEnable monitoring for bare-metal Live Transcoder & Bridge Live installations
Another alternative to enable monitoring is to edit the settings.iniin the Live Transcoder's Advanced setup, changing this line
;monitoring_enabled=1to
monitoring_enabled=1The environment variable TRC_monitoring_enabled takes precedence over the monitoring_enabled setting in the settings.ini.
The settings.ini method works also for the Docker deploymentPlease note that the
settings.inimethod works not only for the bare-metal installations but also for the Docker deployments. Docker users can therefore enable Monitoring either through thedocker-compose.ymlmethod or throughsettings.ini.Please consult the Usage guide for information about
settings.ini.
Next, find the monitoring_group_id setting, remove the ; at the start of the line and set the value to some unique value. It can be human-readable but it should contain a part that makes it unique, e.g. live_transcoder_group_01_a4502e96. After these changes, the line should look like this (with your chosen value in place of the example value).
monitoring_group_id=live_transcoder_group_01_a4502e96Treat this value as a secret! Anyone can see your data on the Monitoring Dashboard if they know the value.
Finally, upload and apply your updated .ini file to Transcoder and restart the service when asked. Next, check that monitoring is enabled.
Check the status of monitoring
You can check the status of the Monitoring service in two places:
- On the Transcoder UI Dashboard in the Services and devices status panel
- On the Setup / System information page
Note that on Bridge Live devices the status is only shown when monitoring is explicitly enabled in settings.ini as the feature is not released for everyone.
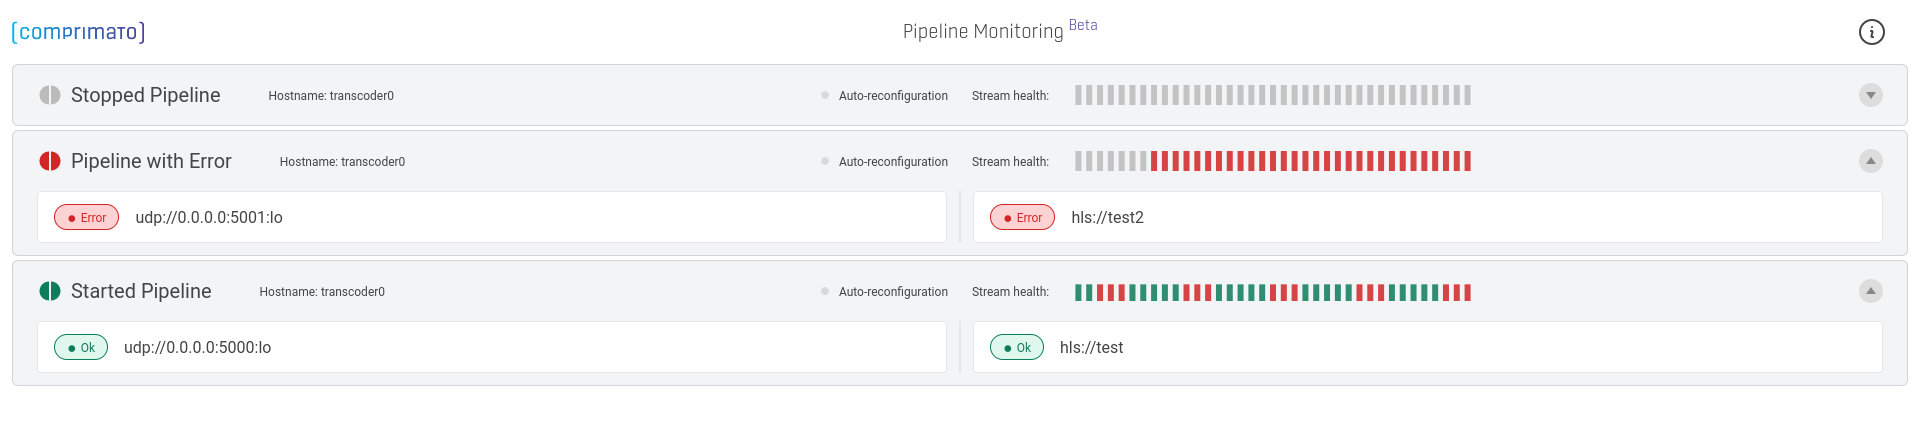
Monitoring Dashboard
The Monitoring Dashboard provides a visual overview of the pipelines tied to a specific Monitoring Group ID. If you have Live Transcoder running with monitoring enabled and currently existing pipelines, you will see the pipelines on the dashboard. Otherwise, you will see a text informing you that no pipelines are visible.
Monitoring Dashboard example
Access the Monitoring Dashboard for Docker deployments
- Go to the Licenses page on the Customer Dashboard.
- Identify the relevant license, and click on the Monitoring Dashboard icon (next to the status badge).
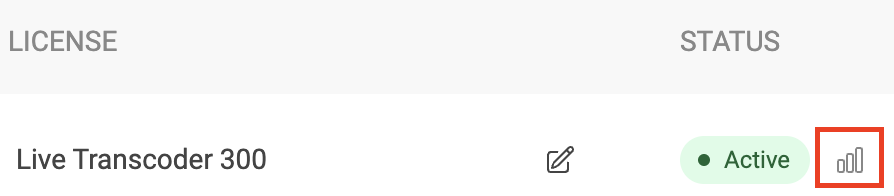
Monitoring Dashboard icon on the Customer Dashboard
Access the Monitoring Dashboard for bare-metal Live Transcoder & Bridge Live installations
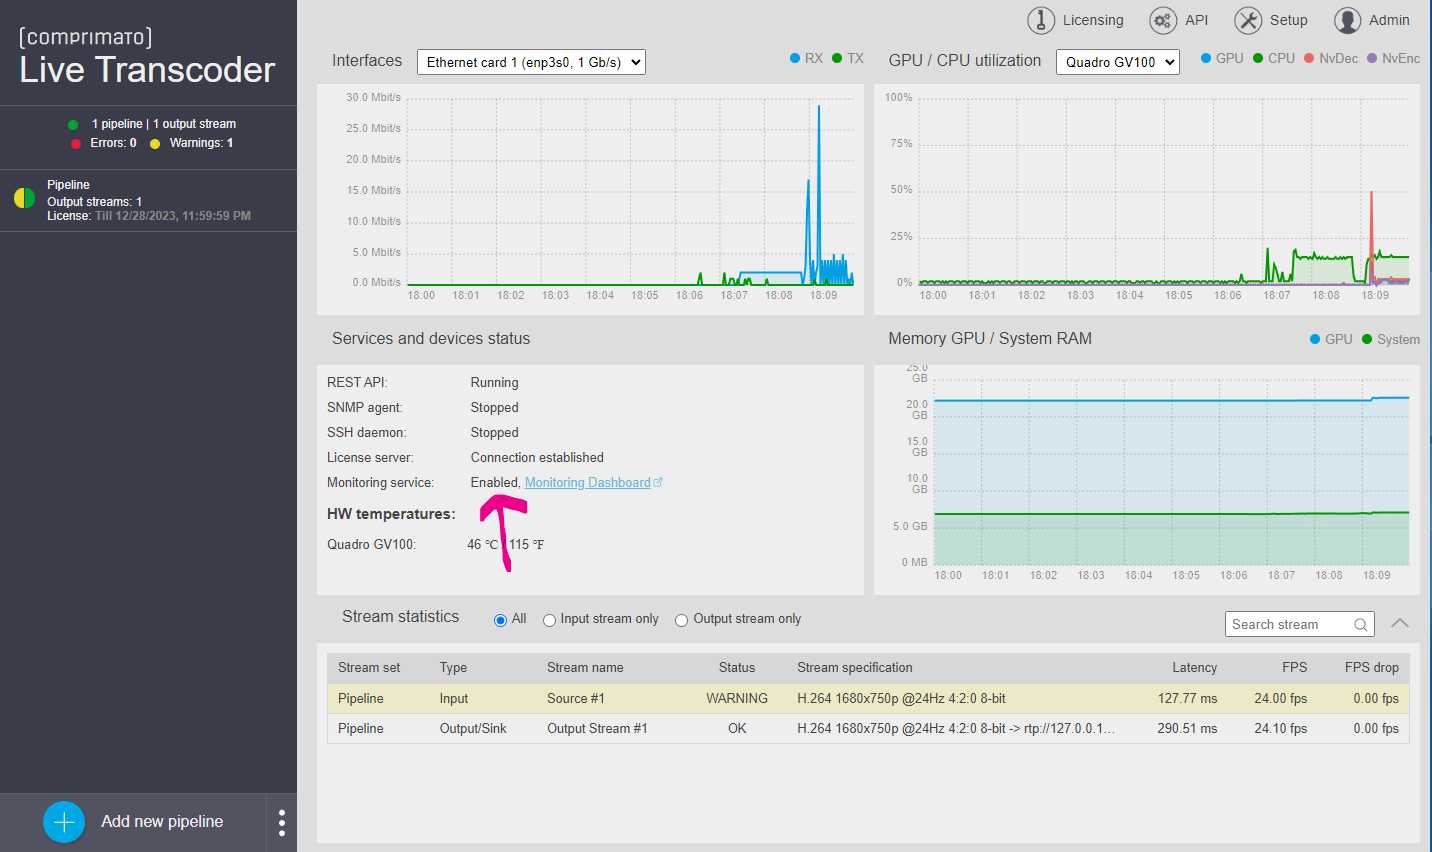
After, you've enabled monitoring in settings.ini, click on the Monitoring Dashboard link
- on the Dashboard page in the Services and devices status panel
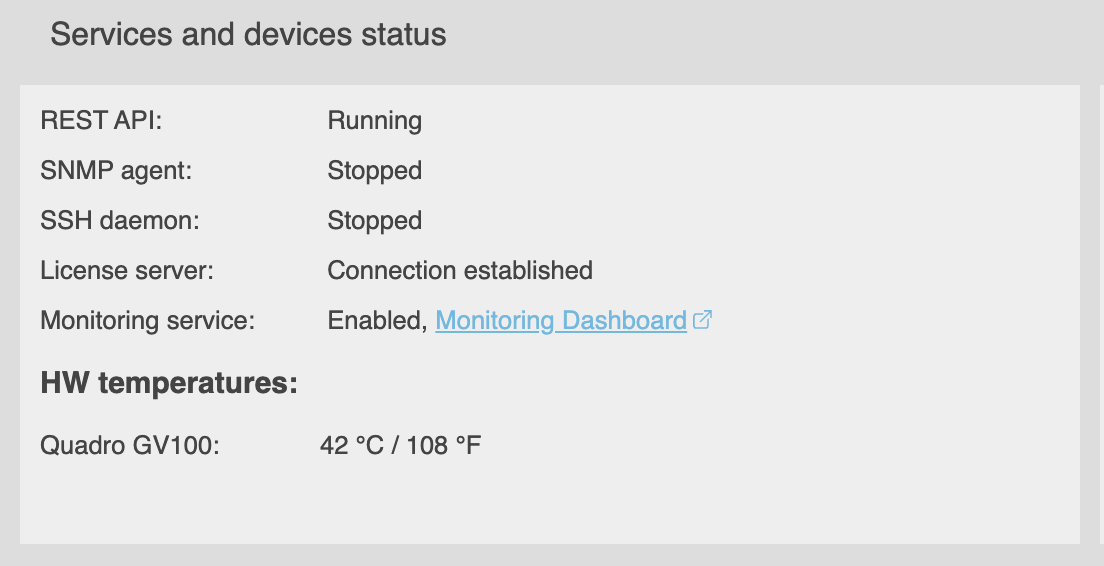
Screenshot from the Dashboard of the Transcoder UI
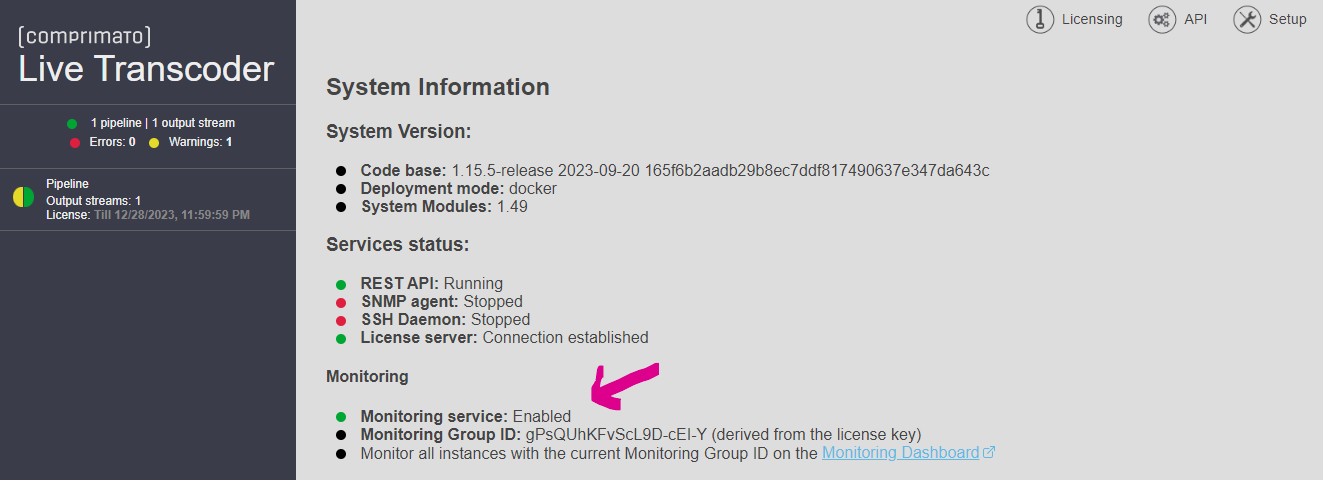
- or on the Setup / System Information page
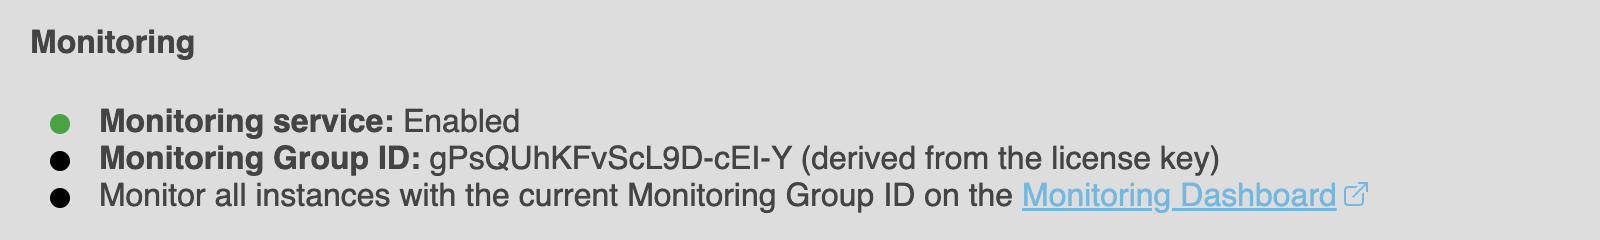
Screenshot from the System Information page of the Transcoder UI
Monitoring Group ID
To logically group multiple instances of Live Transcoder, a Monitoring Group ID is used. It can be created in three ways:
- Derived from the license key - only for Docker deployments. You don't have to configure anything. You can see all pipelines from all Live Transcoders that use the same license key in one place. Monitoring Group ID derived from the license key looks similar to this:
a5bTD-5_cT0FGbJxbS6GA1opGCwtrxG5uMWdoApA-lU. - Custom ID, manually configured in the Advanced Setup - you can set the Monitoring Group ID in the
settings.iniby setting themonitoring_group_idsetting. This might be useful if you want to monitor Live Transcoders, Live Transcoder on-prem installations or Bridge Live using multiple or no license keys. Please use a unique value (UUID or similar) and treat it as a secret because anyone having access to it can see your data on the Monitoring Dashboard. - Temporary - It's automatically generated when no derived or custom Monitoring Group ID is available. It's valid only for one run of the Transcoder service, meaning it's regenerated when the Transcoder service is restarted (or the Live Transcoder/Bridge Live machine reboots).
Updated 4 months ago